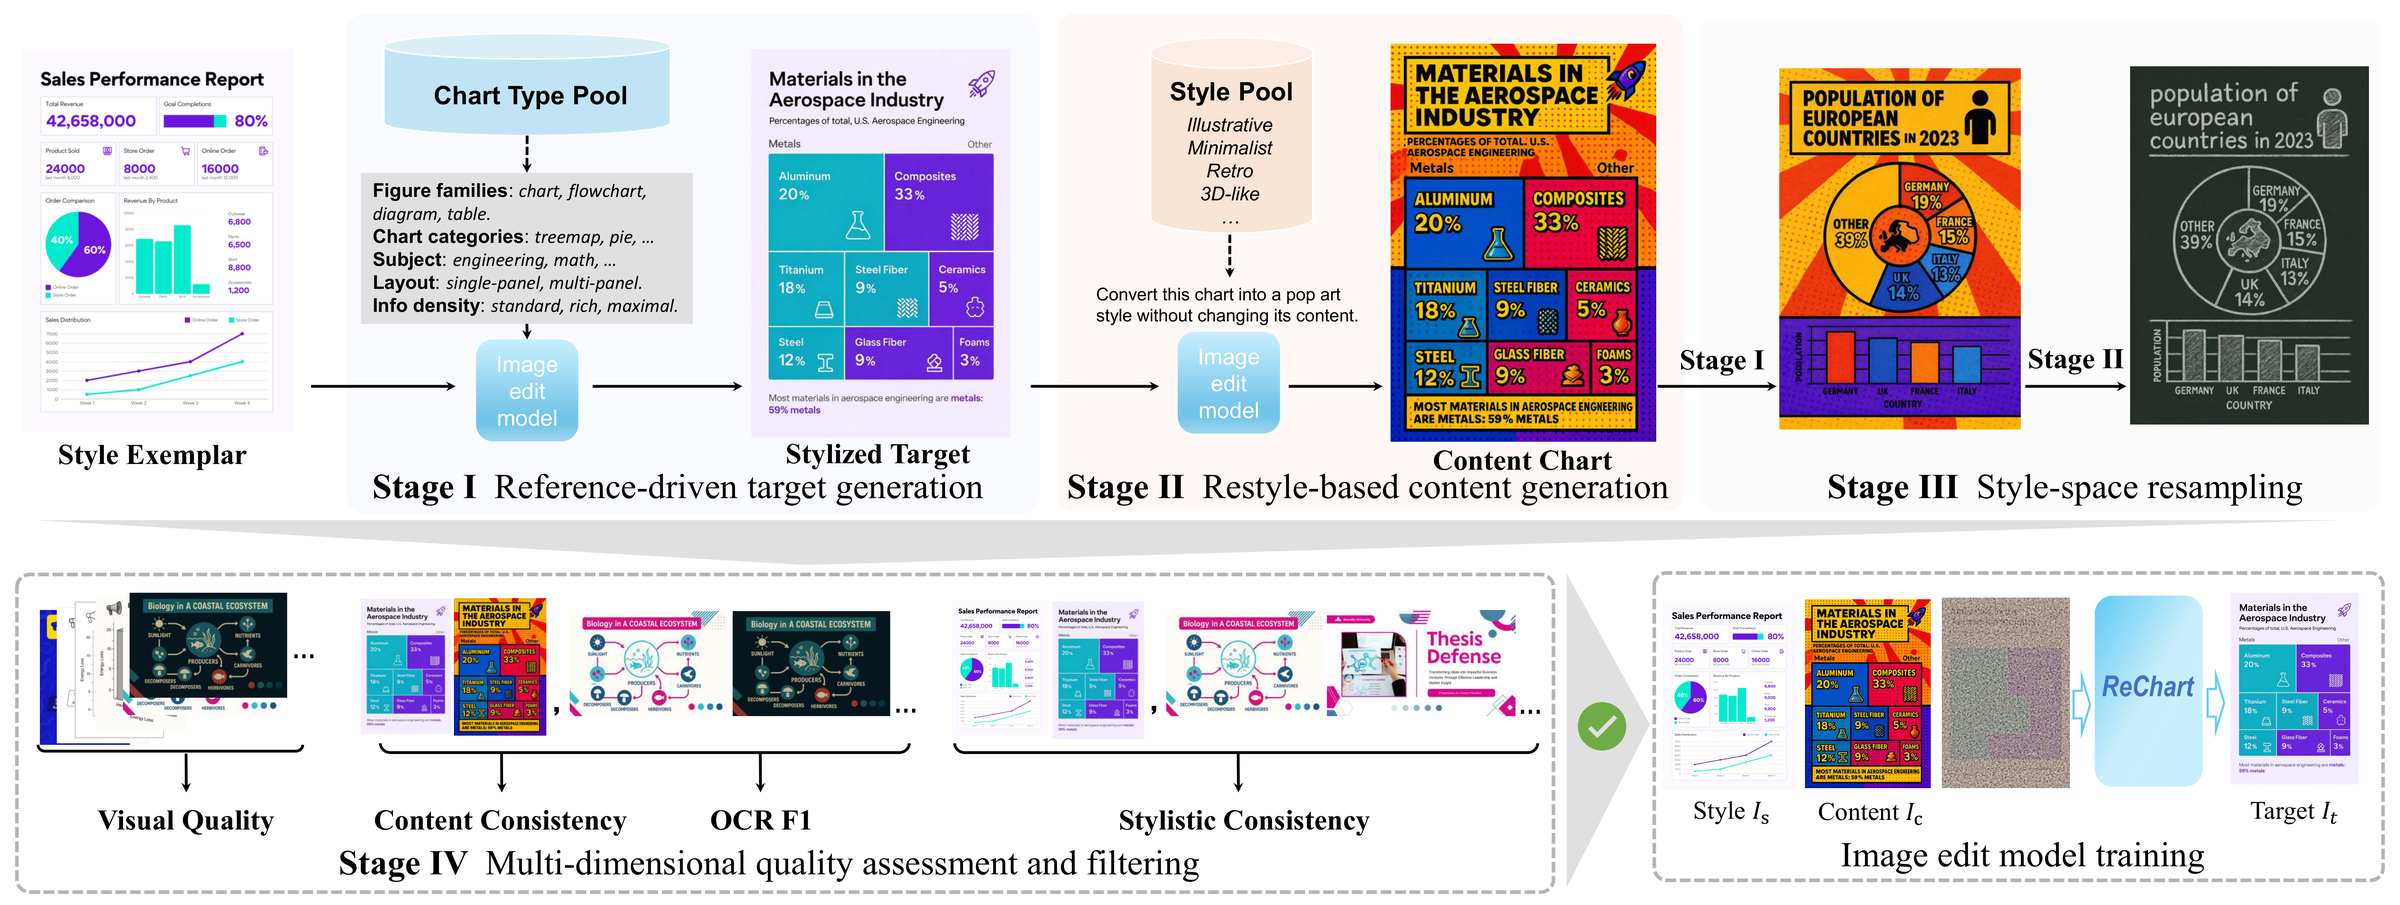
A reverse-generation, dual-stream pipeline that synthesizes the stylized target first, then derives a structure-aligned content chart — cutting content leakage at the data level.
100,744 high-quality style-transfer triplets spanning 36 chart types and 3 visualization families, with style-space resampling and multi-dimensional quality filtering.
300 curated content–style pairs with 6 metrics covering structural fidelity, style consistency, and content integrity — the first systematic testbed for the task.
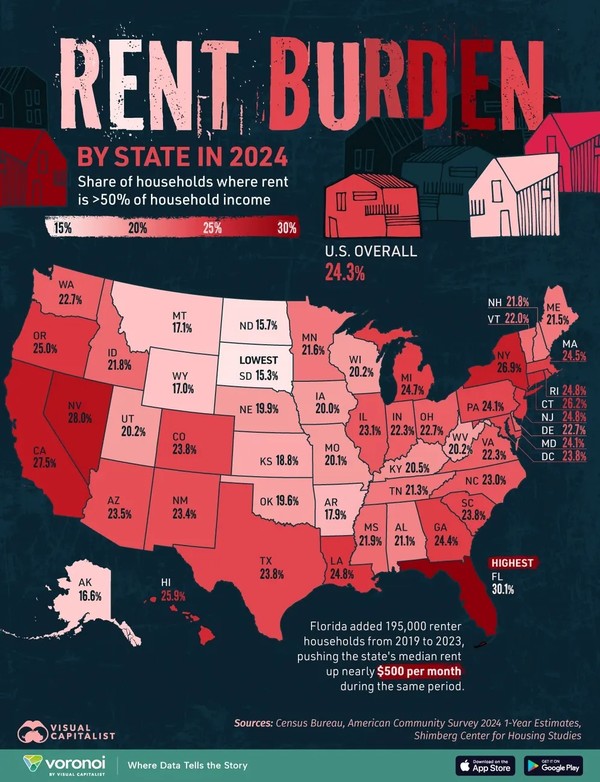
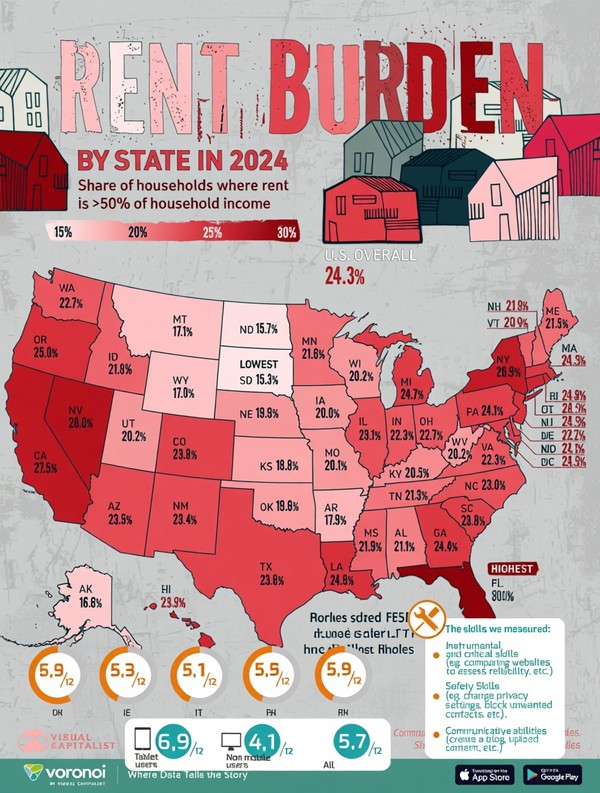
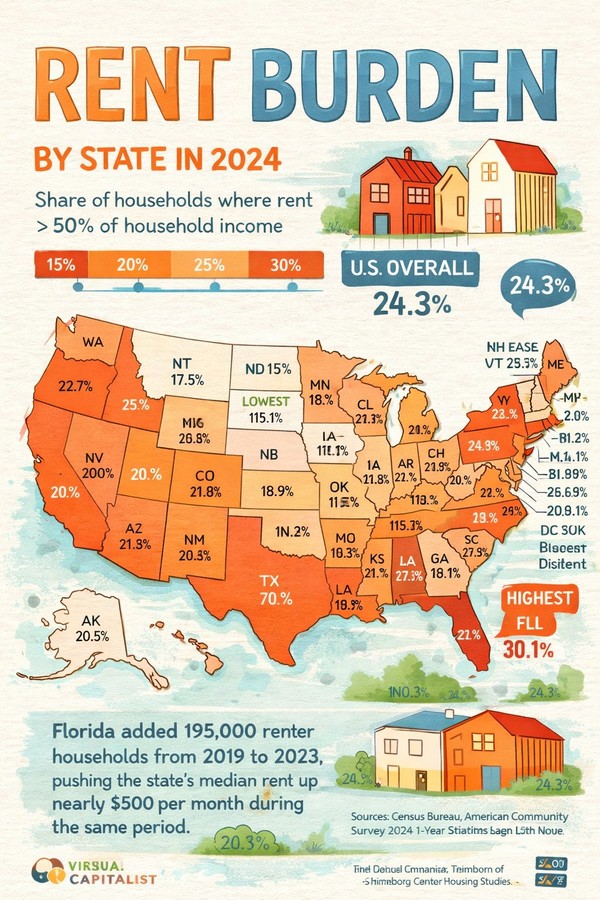
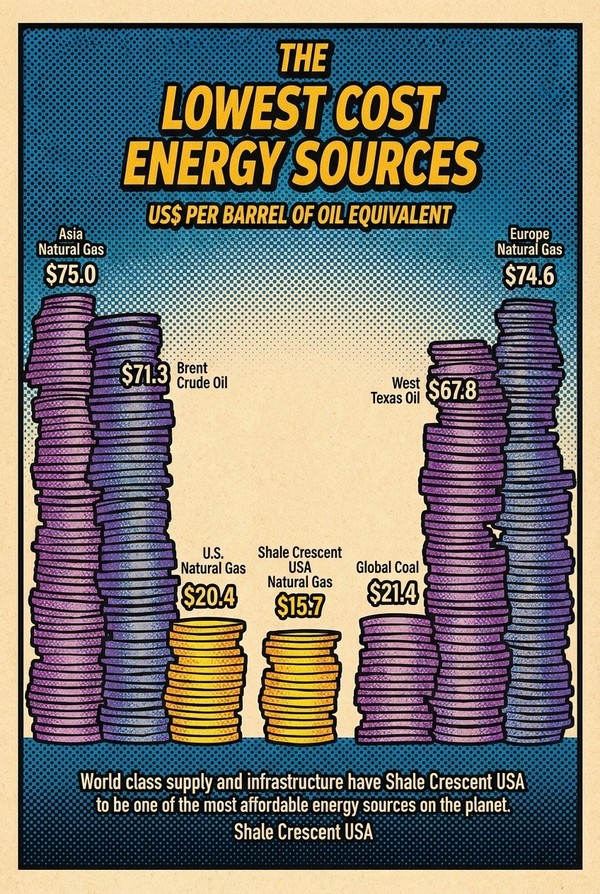
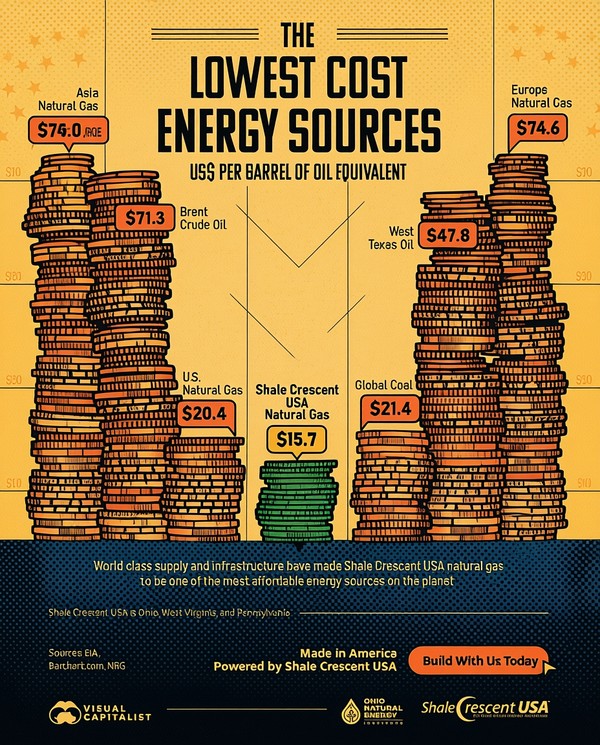
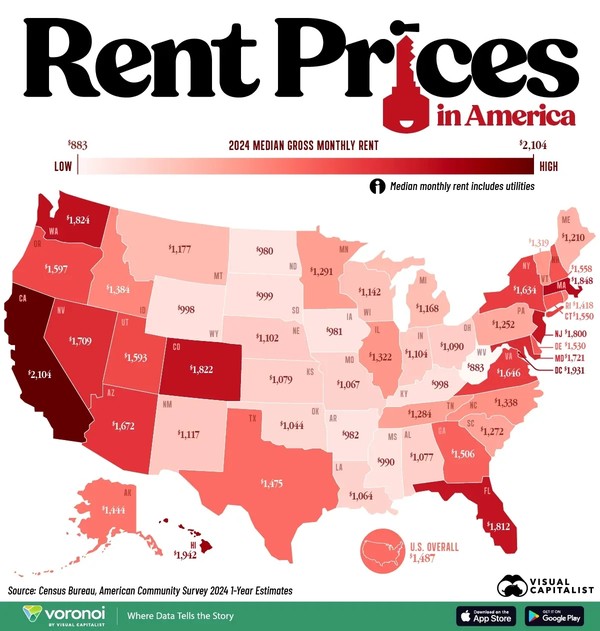
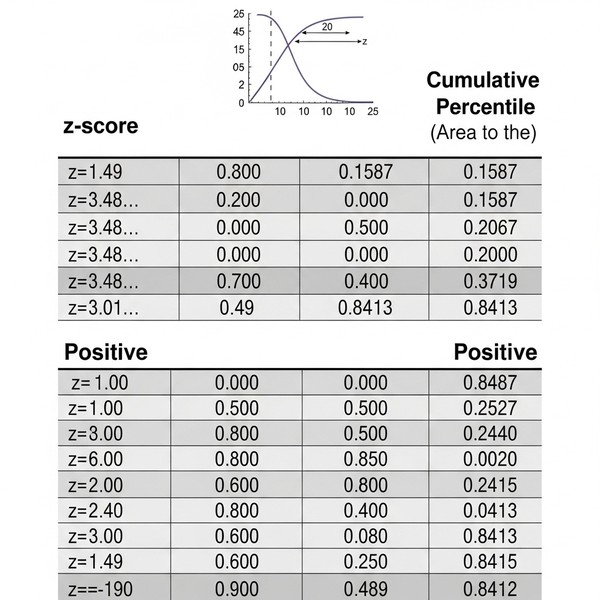
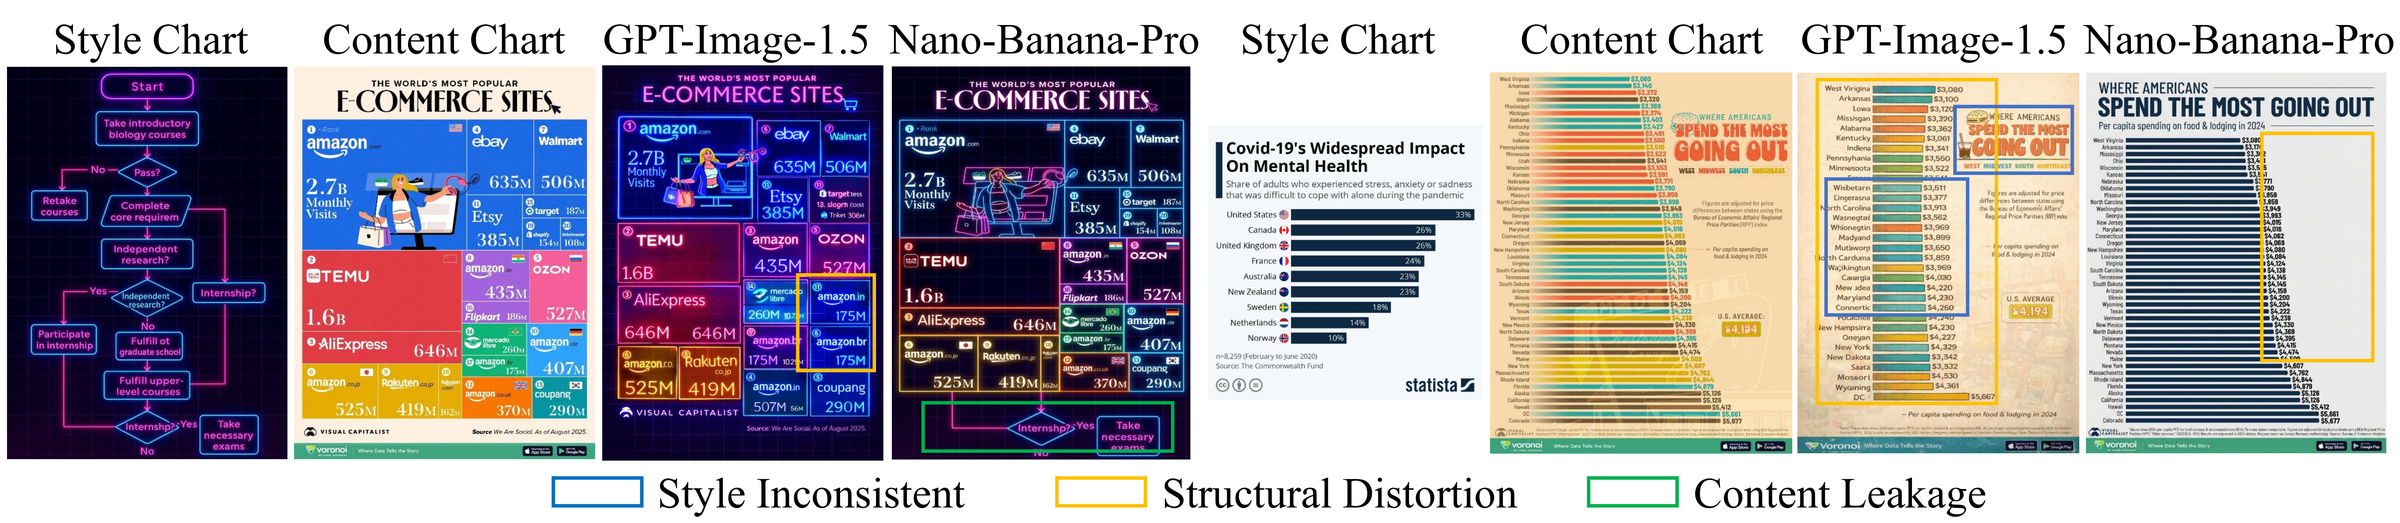
Given an input image, style transfer aims to recast it into the style of a reference image while preserving its content. While this problem is well addressed for natural images, we find that structured images such as charts, diagrams, and tables demand capabilities fundamentally distinct from natural image stylization: visual elements encode data through geometry (bar heights, arc angles, point positions), and dense text must be preserved exactly. We term this structured style transfer: changing appearance while keeping strict element-level fidelity. Even frontier models like GPT-Image-1.5 and Nano-Banana-Pro often struggle here, producing inconsistent transfer, structural distortion, and content leakage. The obvious fix — training on data that restyles a content chart toward a reference — inherits these failures: it distorts the content and leaks the reference into the target.
We introduce ChartForge, a data pipeline that instead builds triplets in reverse: starting from a style image, it produces a target of similar style but different content, then a matching content chart. Because the content is derived from the target, the two stay structurally consistent, with style and content disentangled from the start, avoiding forward-pipeline leakage. With style-space resampling and multi-dimensional filtering, ChartForge yields ChartStyle-100K, over 100K triplets across 36 chart types and 3 visualization families. For evaluation, we further build ChartStyle-Bench, a benchmark of 300 content–style pairs with 6 metrics. Training ReChart by progressively fine-tuning Qwen-Image-Edit on ChartStyle-100K achieves the best overall performance across all baselines, including GPT-Image-1.5 and Nano-Banana-Pro.
Leading image editors fail systematically on structured visualizations — style inconsistency, structural distortion that corrupts data-encoding geometry, and content leakage.
A reverse-generation, dual-stream framework producing structure-consistent triplets (style Is, content Ic, target It).
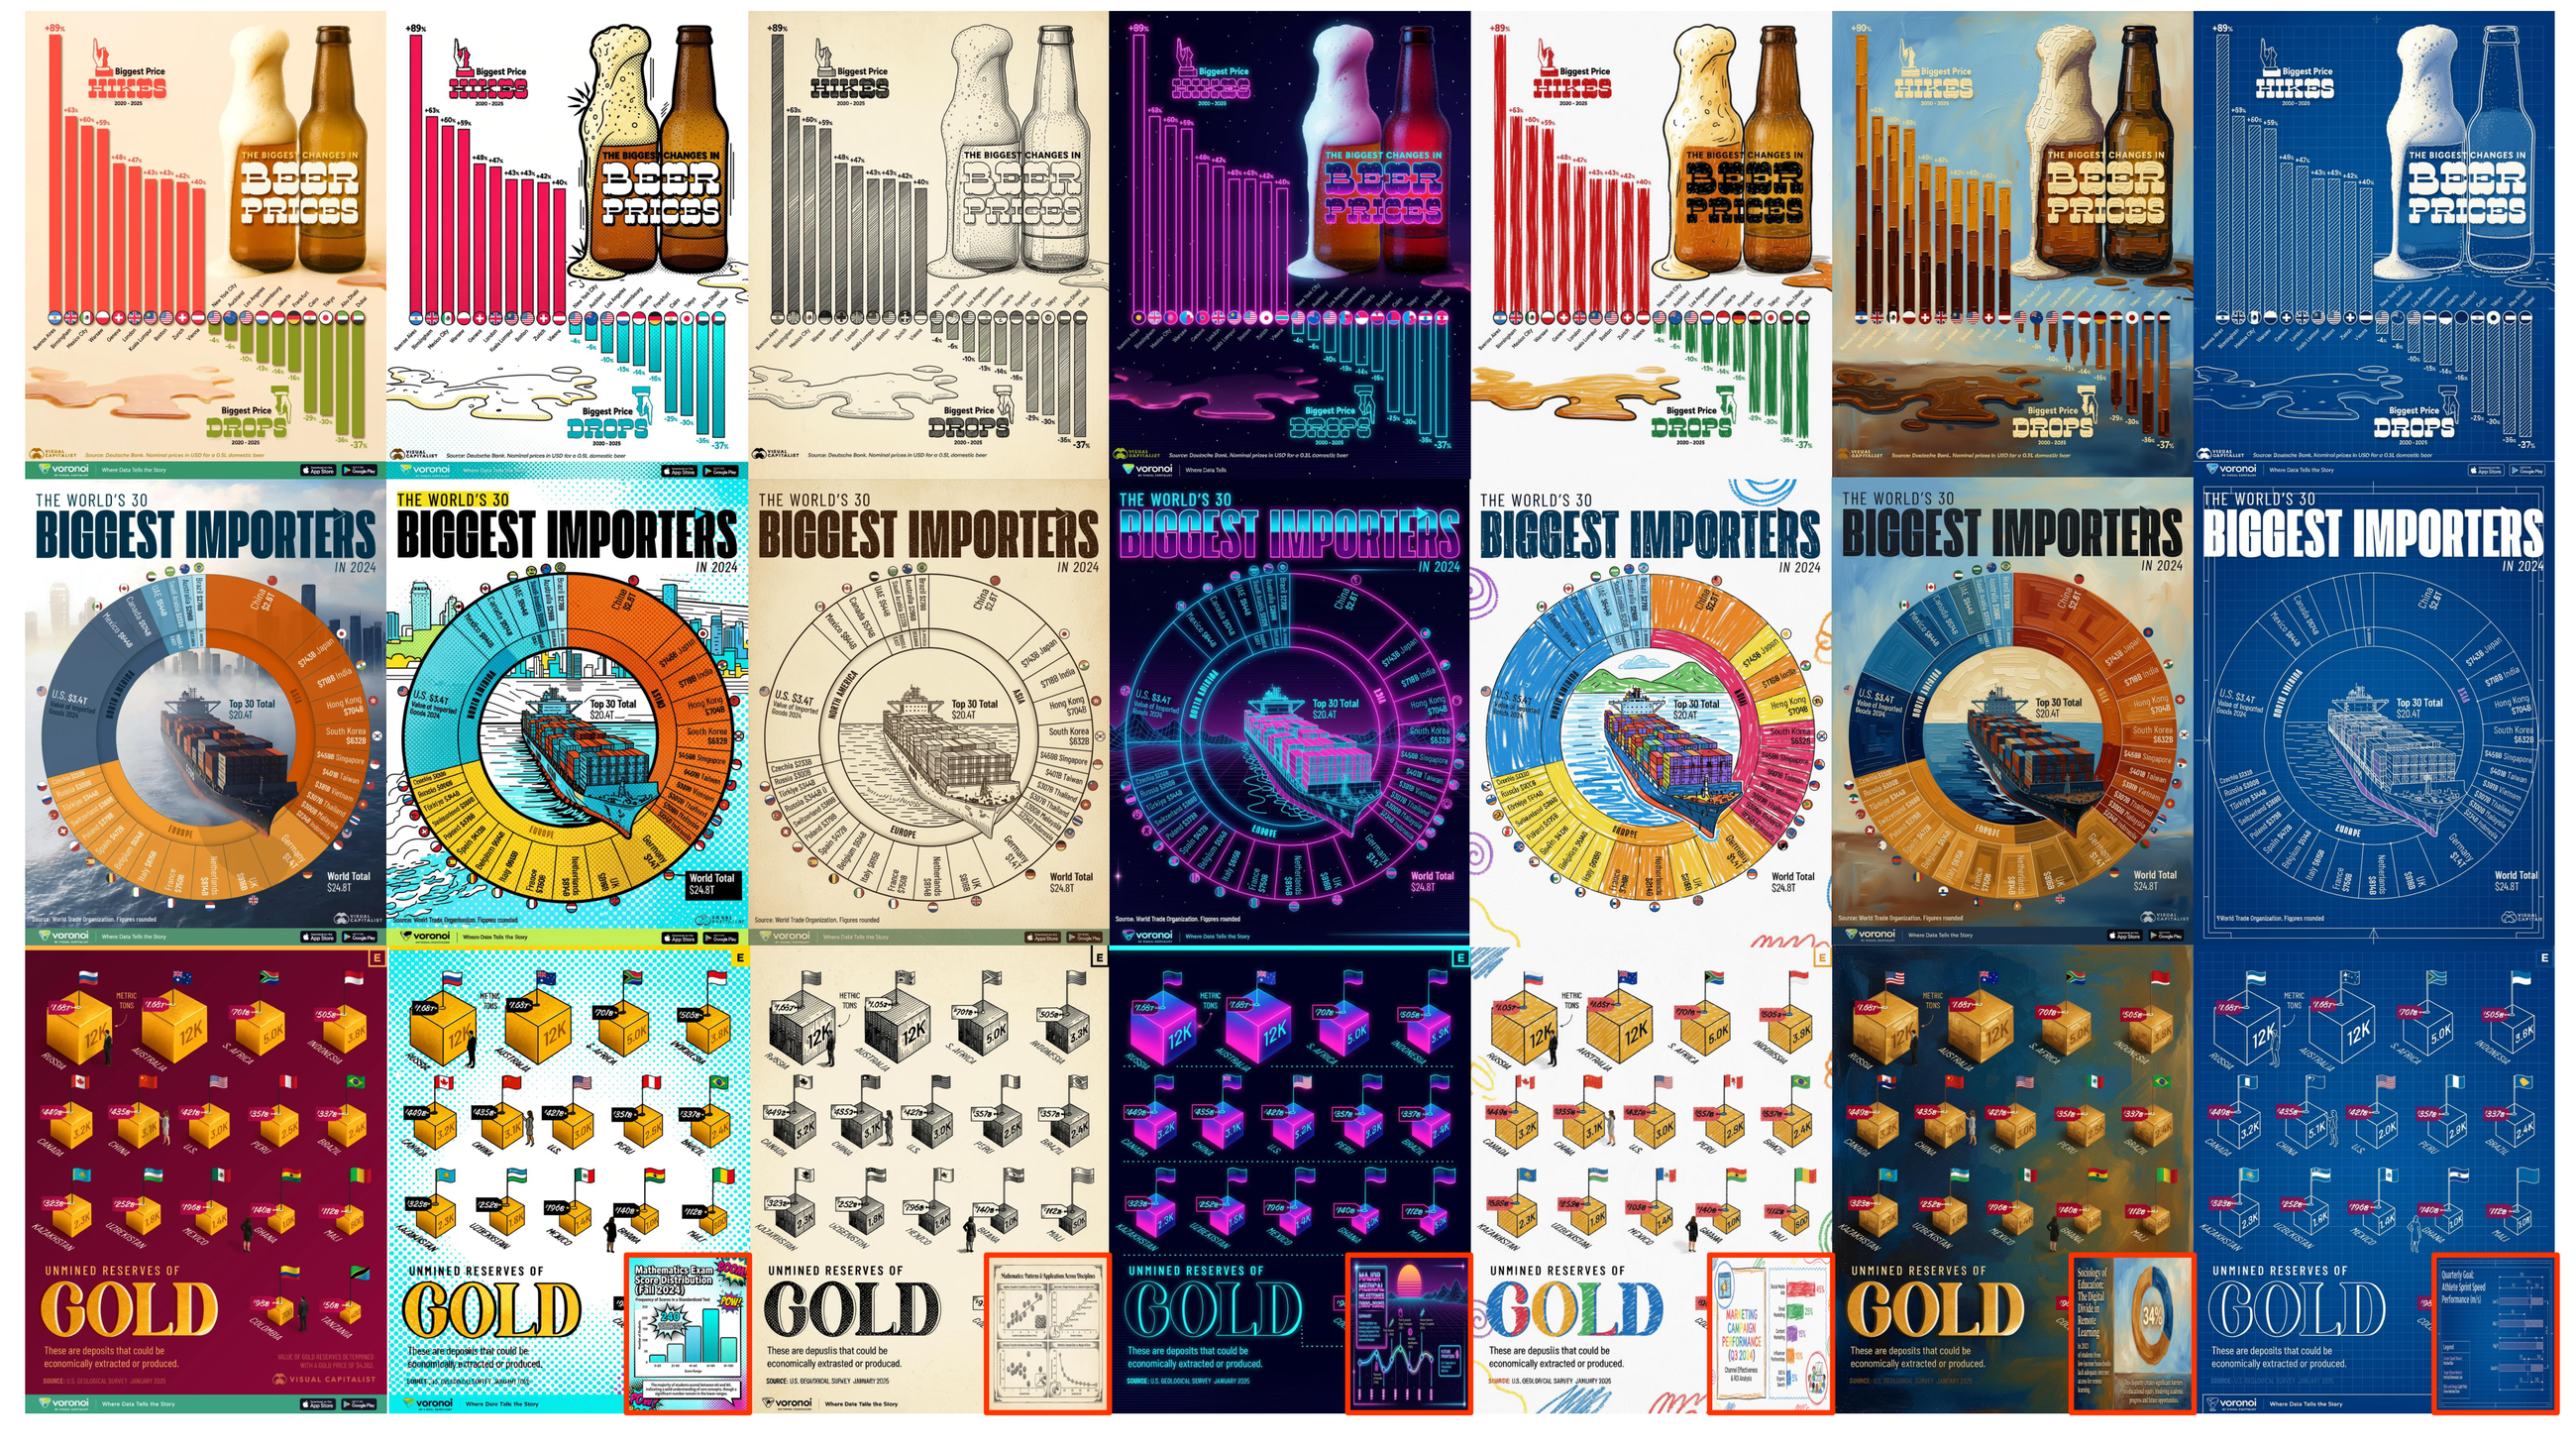
A large-scale dataset for structured visualization style transfer, built entirely by ChartForge.
We obtain ReChart through progressive fine-tuning of Qwen-Image-Edit; its comparison against state-of-the-art baselines on ChartStyle-Bench is shown below. ↑ indicates higher is better, ↓ indicates lower is better; bold marks the best per column.
| Model | LLM Evaluation | Perceptual Metrics | |||||
|---|---|---|---|---|---|---|---|
| Content↑ | Style↑ | Leakage↓ | Overall↑ | Semantic↑ | Fidelity↑ | OCRScore↑ | |
| StyleStudio | 1.00 | 1.67 | 0.06 | 1.17 | 0.58 | 0.47 | 0.01 |
| CSGO | 1.00 | 1.97 | 0.02 | 1.25 | 0.55 | 0.46 | 0.01 |
| OmniGen2 | 1.11 | 2.66 | 0.57 | 1.14 | 0.54 | 0.53 | 0.04 |
| FLUX.2-dev | 1.75 | 3.80 | 0.80 | 1.29 | 0.59 | 0.73 | 0.26 |
| Edit-R1 | 1.85 | 3.25 | 0.63 | 1.35 | 0.65 | 0.66 | 0.28 |
| Seedream 4.0 | 2.39 | 3.70 | 0.51 | 2.00 | 0.74 | 0.56 | 0.50 |
| GPT-Image-1 | 2.31 | 2.96 | 0.05 | 2.30 | 0.77 | 0.46 | 0.54 |
| GPT-Image-1.5 | 3.30 | 3.04 | 0.06 | 2.82 | 0.80 | 0.48 | 0.73 |
| Nano-Banana | 3.57 | 2.66 | 0.20 | 2.44 | 0.87 | 0.50 | 0.77 |
| Nano-Banana-2 | 3.48 | 3.75 | 0.48 | 2.59 | 0.76 | 0.54 | 0.71 |
| Nano-Banana-Pro | 3.79 | 3.58 | 0.32 | 2.84 | 0.77 | 0.54 | 0.72 |
| Qwen-Image-Edit | 2.75 | 2.73 | 0.51 | 1.58 | 0.76 | 0.62 | 0.54 |
| ReChart (Ours) | 3.96 | 2.90 | 0.05 | 3.03 | 0.89 | 0.49 | 0.76 |
ReChart achieves the best overall score and content preservation while keeping content leakage low and stylistic fidelity competitive against state-of-the-art commercial models.
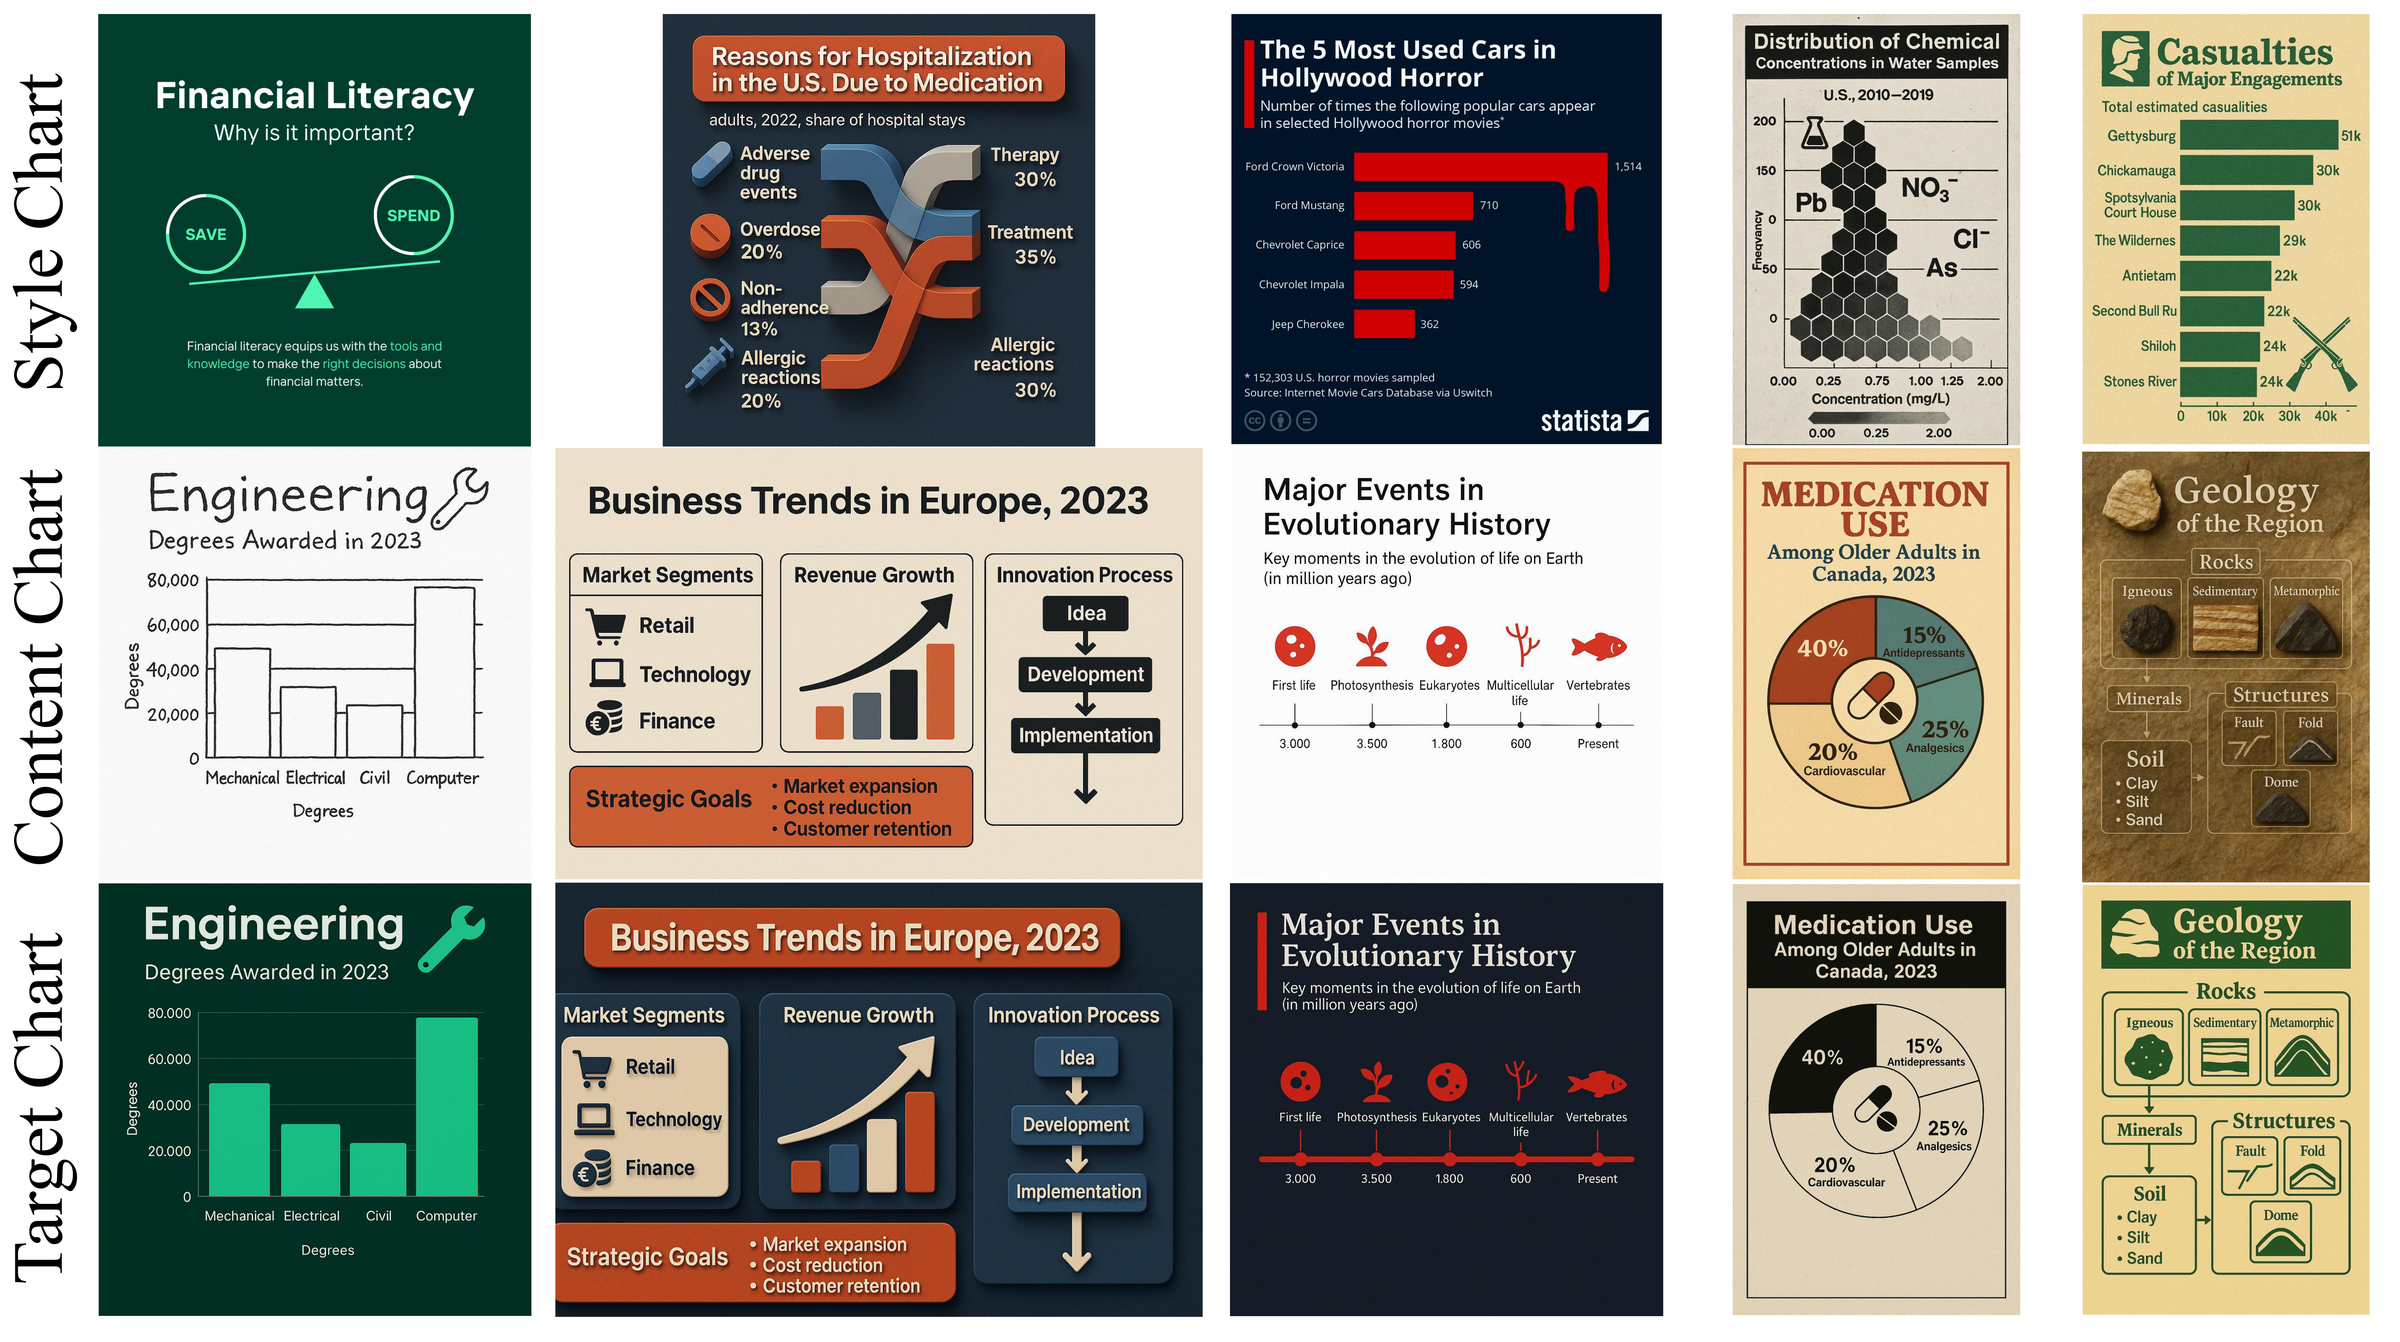
Given a style reference and a content chart, baselines often show style misalignment, structural distortion, text errors, or content leakage — ReChart yields the best overall results.